The core hypothesis
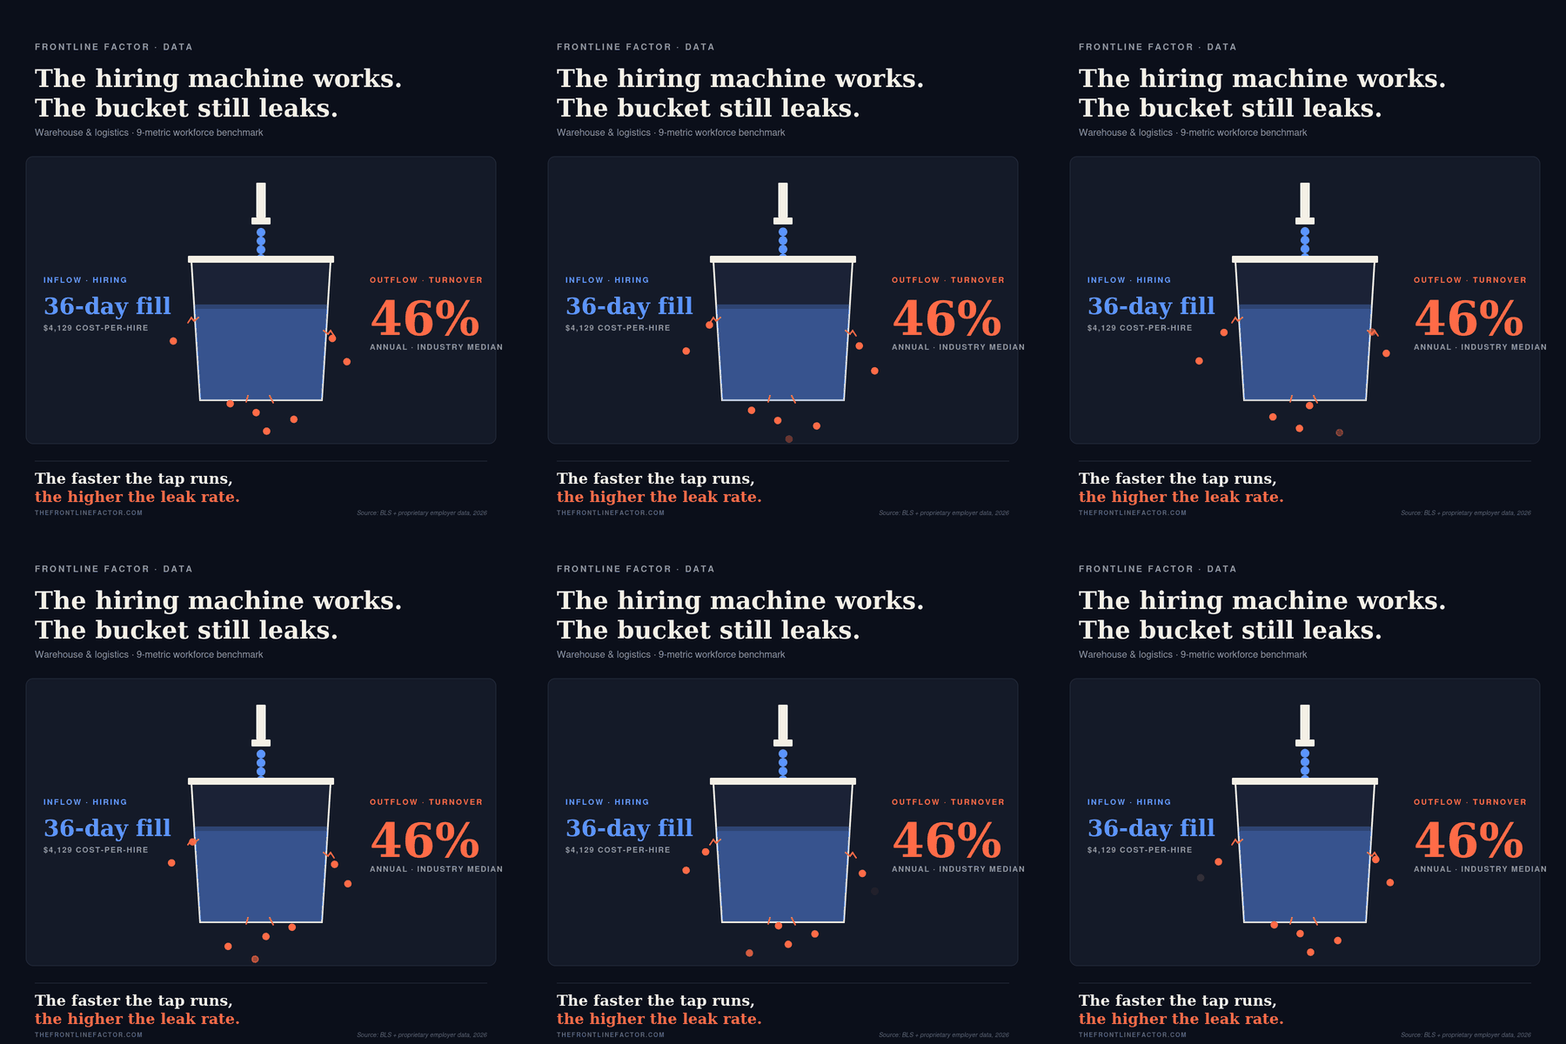
The warehousing and logistics industry has gotten remarkably good at one thing: replacing people quickly. The latest Frontline Factor Workforce Benchmark — drawn from BLS data with employer-level metrics across nine workforce indicators — shows median time-to-fill at 36 days, cost-per-hire at $4,129, and 90-day retention at 72%. By the standards of any other frontline-heavy industry, those are competitive numbers.
There is just one problem. The same benchmark puts industry median turnover at 46%.
Elevated workforce churn creates operational pressure through constant onboarding cycles, productivity variability, reduced process familiarity, and increased supervisory burden.
The industry has built a world-class front door — and a back door that won’t close.
This chart uses illustrative company data benchmarked against BLS industry medians, but it highlights a broader industry pattern: more workers are leaving the sector than entering it.
The hiring machine is working, but at what cost?
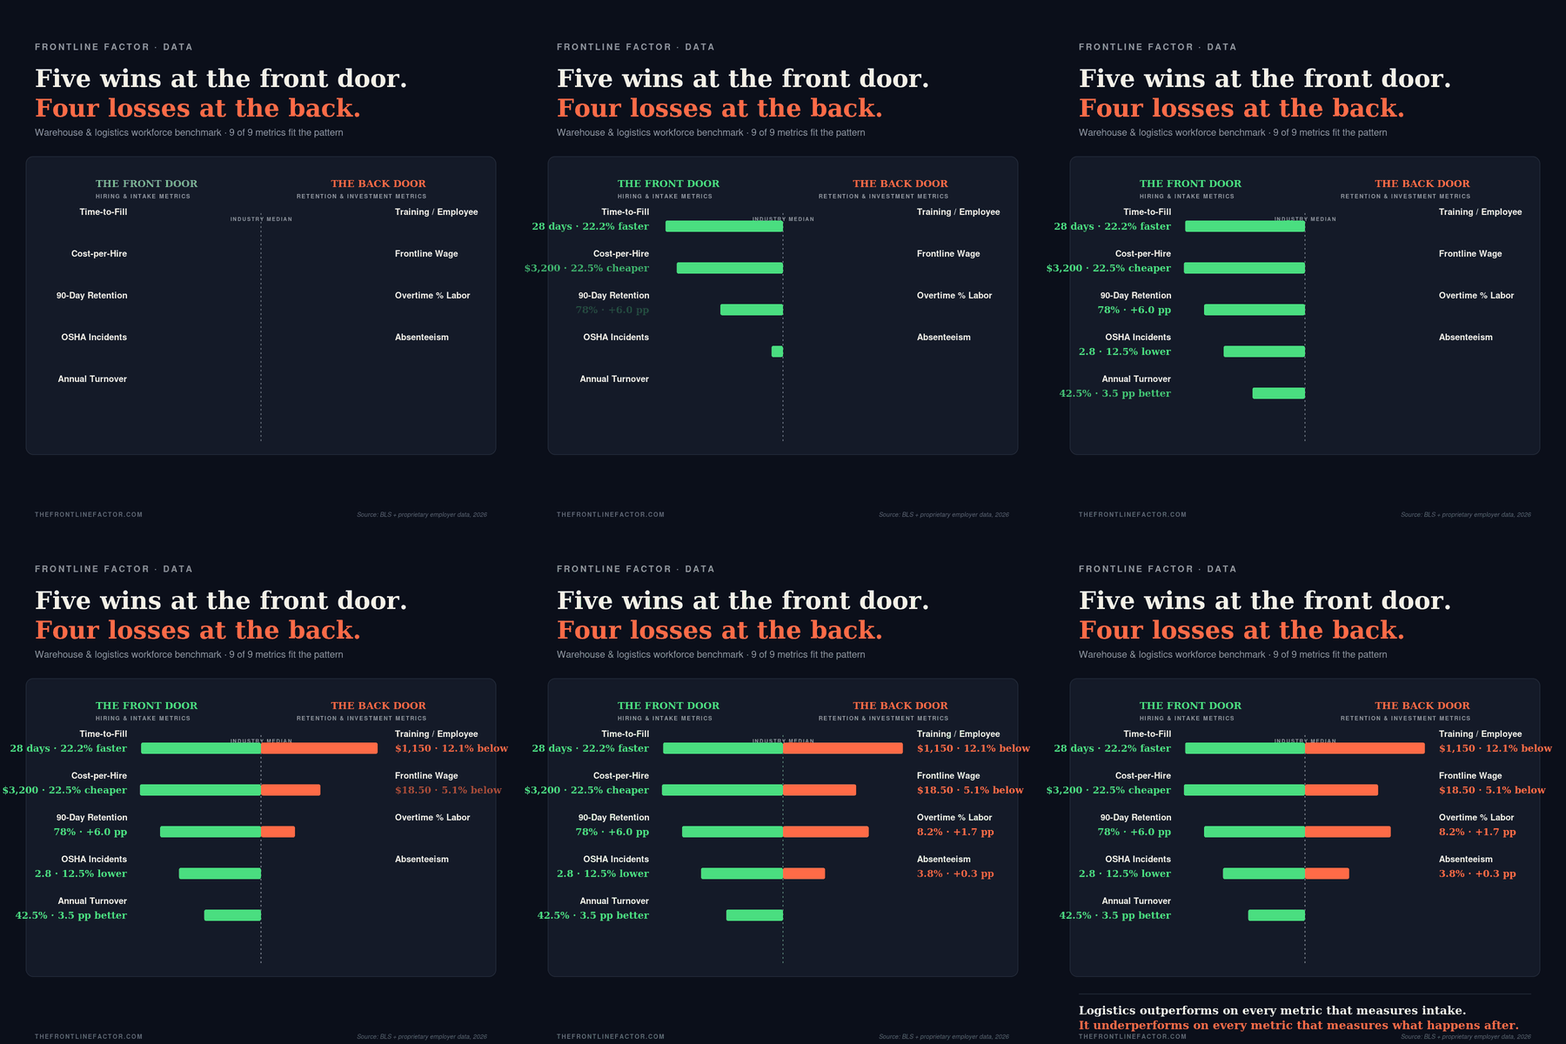
If you sort the benchmark for what warehouse and logistics does well, the pattern is impossible to miss. Every metric where operators outperform the median has the word hire or intake embedded somewhere in its definition.
Top performers are filling roles in comparable organizations in around 28 days — about a third faster than the industry median. When referencing our illustrative example, they are spending a third less per hire. And typically, they are getting new associates through the first 90 days at a 78% rate, six points above the median.
OSHA incident rates among the top tier run 2.8 per 100 workers, meaningfully better than the 3.2 industry average.
Those are real wins.
Faster fills mean fewer open shifts and less weekend overtime. Lower cost-per-hire means margin to redeploy.
Stronger 90-day retention means more of every recruiting dollar actually translates into a productive employee. But all five outperforming metrics share a structural feature: they describe the same window of time — before and during a worker’s first 90 days. The benchmark figures start lagging, or worse, after that.
Together, they describe a single operating mode: fill the seat, light up the floor, push the pace, accept the churn. The 46% annual turnover rate is what that operating mode produces as a result.
A 46% turnover rate means the average warehouse operator rehires roughly half its frontline workforce every twelve months — spending more than $1.9M a year per 1,000 associates just to replace people who walked out.
That is before lost productivity from green floors, supervisor time pulled into onboarding, the safety risk of an inexperienced workforce, and the customer service cost of stockouts and missed SLAs.
What separates the leaders
The most useful thing in any benchmark is rarely the median. It is the spread. When the data is sliced by stronger-performing operators, the operators pulling ahead do not look dramatically different on the hiring metrics most warehouse leaders obsess over. Time-to-fill differences are real but modest.
Cost-per-hire variation is largely a function of geography and labor-market tightness.
The real spread is in what happens after Day 1. Stronger operators run 90- day retention six to eight points above the median. They run overtime ratios two to three points lower, and invest more per employee per year in training.
Critically, their absenteeism rate runs roughly a full point below the median: a leading indicator that translates, into materially lower turnover the following year.
None of those levers is a single feature or a single program.
They are operational decisions, made every day, about the post-hire experience: whether new hires get a real onboarding or a vest and a badge; whether schedules are communicated five days out or five hours out; whether associates can see open shifts and pick them up themselves; whether recognition flows back to the floor; whether a frontline worker who has a question can get an answer without finding their manager.
The benchmark does not measure any of those things directly. But it measures their downstream effects in five different places. The part of the benchmark worth obsessing over The takeaway from a warehouse and logistics workforce benchmark in 2026 is not that the industry needs to hire faster.
The hiring machine has become a coping mechanism: a way to keep operations running despite a workforce model that loses nearly half its people every year. The operators who break out of that pattern treat the first 12 months on the floor as an investment, not a hurdle. They put real money behind training. They build scheduling and communication systems that respect frontline workers as adults. They measure engagement alongside attendance. The math eventually rewards them. Lower turnover compounds. Better-trained associates work safer.
Engaged frontline workers stay longer, and the smaller number who do leave cost less to replace. That is the part of the benchmark worth obsessing over.
Get the monthly Frontline Factor Newsletter
New data reports, frontline trends, and executive briefings — straight to your inbox.